Tidy Evaulation in R
1 Motivation
为什么需要tidy evaluation?
很多时候,我们需要建立一些wrapping
functions,这些函数是建立在dplyr或者ggplot2之上的,函数中的参数
function(data, xvar, yvar, ...) 往往是data
中的某个列。我们来举个例子吧,
library(zetaEDA)
enable_zeta_ggplot_theme()
The data is diamonds data set,
dat <- diamonds %>% head(1000)

print_kbl(head(dat))| carat | cut | color | clarity | depth | table | price | x | y | z |
|---|---|---|---|---|---|---|---|---|---|
| 0.23 | Ideal | E | SI2 | 61.5 | 55 | 326 | 3.95 | 3.98 | 2.43 |
| 0.21 | Premium | E | SI1 | 59.8 | 61 | 326 | 3.89 | 3.84 | 2.31 |
| 0.23 | Good | E | VS1 | 56.9 | 65 | 327 | 4.05 | 4.07 | 2.31 |
| 0.29 | Premium | I | VS2 | 62.4 | 58 | 334 | 4.20 | 4.23 | 2.63 |
| 0.31 | Good | J | SI2 | 63.3 | 58 | 335 | 4.34 | 4.35 | 2.75 |
| 0.24 | Very Good | J | VVS2 | 62.8 | 57 | 336 | 3.94 | 3.96 | 2.48 |
The common task is to compute group mean,
dat %>%
  group_by(color) %>%
  summarise(mean_price = mean(price, na.rm = TRUE))
## # A tibble: 7 × 2
## color mean_price
## <ord> <dbl>
## 1 D 2594.
## 2 E 2543.
## 3 F 2692.
## 4 G 2576.
## 5 H 2308.
## 6 I 1948.
## 7 J 1990.How to build a function to compute the group mean?
Maybe you would like to try this:
# define the function
cal_group_mean <- function(data, group_var, mean_var) {
  data %>%
    group_by(group_var) %>%
    summarize(mean = mean(mean_var, na.rm = TRUE))
}

# first try
cal_group_mean(dat, group_var = color, mean_var = price)
## Error in `group_by()`:
## ! Must group by variables found in `.data`.
## ✖ Column `group_var` is not found.NOT Work! OK, let’s try this,
# second try
cal_group_mean(dat, group_var = "color", mean_var = "price")
## Error in `group_by()`:
## ! Must group by variables found in `.data`.
## ✖ Column `group_var` is not found.In order to make it work, what you need is the Tidy Evaluation!
# define the function again, use tidy evaluation
cal_group_mean <- function(data, group_var, mean_var) {
  group_var <- enquo(group_var)
  mean_var <- enquo(mean_var)

  data %>%
    group_by(!!group_var) %>%
    summarize(mean = mean(!!mean_var, na.rm = TRUE))
}

# the correct result
cal_group_mean(dat, group_var = color, mean_var = price)
## # A tibble: 7 × 2
## color mean
## <ord> <dbl>
## 1 D 2594.
## 2 E 2543.
## 3 F 2692.
## 4 G 2576.
## 5 H 2308.
## 6 I 1948.
## 7 J 1990.2 quo() function & “bang bang” !!
In the example below we use the quo function and the “bang-bang” !!
operator to set color as our group by variable.
The “
quo” function allows us to store the variable name in our “group_var” variable“
!!” extracts the stored variable name.
# store the varibale name in 'group_var'
group_var <- quo(color)

class(group_var)
## [1] "quosure" "formula"dat %>%
# extract the stored variable name using 'bang bang'
group_by(!!group_var) %>%
summarize(mean = mean(price, na.rm = TRUE))## # A tibble: 7 × 2
## color mean
## <ord> <dbl>
## 1 D 2594.
## 2 E 2543.
## 3 F 2692.
## 4 G 2576.
## 5 H 2308.
## 6 I 1948.
## 7 J 1990.注意:上面的代码并没有写在函数的内部,如果我们需要使用tidy evaluation的方式来写函数的话,不要用
quo,需要使用enquo!
3 enquo() function & “bang bang” !!
To use tidy evaluation in a function, we will still use the “!!”
operator as we did above, but instead of “quo” we will use the
enquo function.
cal_group_stats <- function(data, group_var, target_var) {
  # store the variable name using `enquo`
  group_var <- enquo(group_var)
  target_var <- enquo(target_var)

  data %>%
    # extract the stored variable using bang-bang !!
    group_by(!!group_var) %>%
    summarize(across(!!target_var, list(
      mean = ~ mean(.x, na.rm = TRUE),
      sd = ~ sd(.x, na.rm = TRUE)
    )))
}

# try
cal_group_stats(dat, group_var = clarity, target_var = price)
## # A tibble: 8 × 3
## clarity price_mean price_sd
## <ord> <dbl> <dbl>
## 1 I1 2674. 618.
## 2 SI2 2489. 840.
## 3 SI1 2440. 873.
## 4 VS2 2616. 669.
## 5 VS1 2383. 928.
## 6 VVS2 2497. 828.
## 7 VVS1 2159. 1051.
## 8 IF 2829. 38.0cal_group_stats(dat, group_var = NULL, target_var = price)## # A tibble: 1 × 2
## price_mean price_sd
## <dbl> <dbl>
## 1 2477. 840.4 The “Curly-Curly” Shortcut {{}}
The “curly-curly” {{
}} operator
directly extracts a stored variable name from “target_var” in the
example below. In the prior example we needed both “enquo” and “!!”
to evaluate a variable like this so the “curly-curly” operator is a
convenient shortcut.
cal_group_stats2 <- function(data, group_var, target_var) {
  # store the variable name using `enquo`
  group_var <- enquo(group_var)

  data %>%
    group_by(!!group_var) %>%
    # using `{{}}` as shortcut
    summarize(across({{ target_var }}, list(
      mean = ~ mean(.x, na.rm = TRUE),
      sd = ~ sd(.x, na.rm = TRUE)
    )))
}

# check
cal_group_stats2(dat, group_var = clarity, target_var = price)
## # A tibble: 8 × 3
## clarity price_mean price_sd
## <ord> <dbl> <dbl>
## 1 I1 2674. 618.
## 2 SI2 2489. 840.
## 3 SI1 2440. 873.
## 4 VS2 2616. 669.
## 5 VS1 2383. 928.
## 6 VVS2 2497. 828.
## 7 VVS1 2159. 1051.
## 8 IF 2829. 38.0identical(
cal_group_stats(dat, group_var = clarity, target_var = price),
cal_group_stats2(dat, group_var = clarity, target_var = price)
)## [1] TRUERemark:
{{}}is the shortcut ofenquo()and!!.
5 as_label() function and := operator
How can I use the variable name? The answer is as_label() function.
print_class <- function(data, myvar) {
  myvar1 <- enquo(myvar)
  message("Understand the class of `enquo(myvar)`:")
  print(class(myvar1))

  myvar2 <- as_label(enquo(myvar))
  message("Understand the class of `as_label(enquo(myvar))`:")
  print(class(myvar2))
}

# check
print_class(dat, myvar = color)
## Understand the class of `enquo(myvar)`:## [1] "quosure" "formula"## Understand the class of `as_label(enquo(myvar))`:## [1] "character"We will illustrate the as_label() using the below example:
The as_label function extracts the string value of the
target_varvariable (pricein this case). We use this to set the value of thetarget_varcolumn.If you want to extract the string variable name with the
as_labelfunction, you will still need to useenquoand!!. You CANNOT use the{{}}shortcut!
cal_group_stats3 <- function(data, group_var, target_var) {
  # store the variable name using `enquo`
  group_var <- enquo(group_var)
  target_var <- enquo(target_var)

  data %>%
    group_by(!!group_var) %>%
    summarize(across(!!target_var, list(
      mean = ~ mean(.x, na.rm = TRUE),
      sd = ~ sd(.x, na.rm = TRUE)
    ))) %>%
    mutate(varName = as_label(target_var))
}

# check
cal_group_stats3(dat, group_var = color, target_var = price)
## # A tibble: 7 × 4
## color price_mean price_sd varName
## <ord> <dbl> <dbl> <chr>
## 1 D 2594. 712. price
## 2 E 2543. 769. price
## 3 F 2692. 553. price
## 4 G 2576. 715. price
## 5 H 2308. 974. price
## 6 I 1948. 1141. price
## 7 J 1990. 1181. priceLet’s see another example: using the variable name in ggplot title.
plotxy <- function(data, xvar, yvar) {
  xvar <- enquo(xvar)
  yvar <- enquo(yvar)
  data_name <- as_label(enquo(data))

  data %>%
    ggplot(aes(x = !!xvar, y = !!yvar)) +
    geom_point() +
    geom_smooth() +
    # using variable name in the title
    ggtitle(str_c(
      as_label(yvar), " vs. ", as_label(xvar),
      " in ", data_name, " data"
    ))
}

# check
plotxy(iris, xvar = Sepal.Length, yvar = Sepal.Width)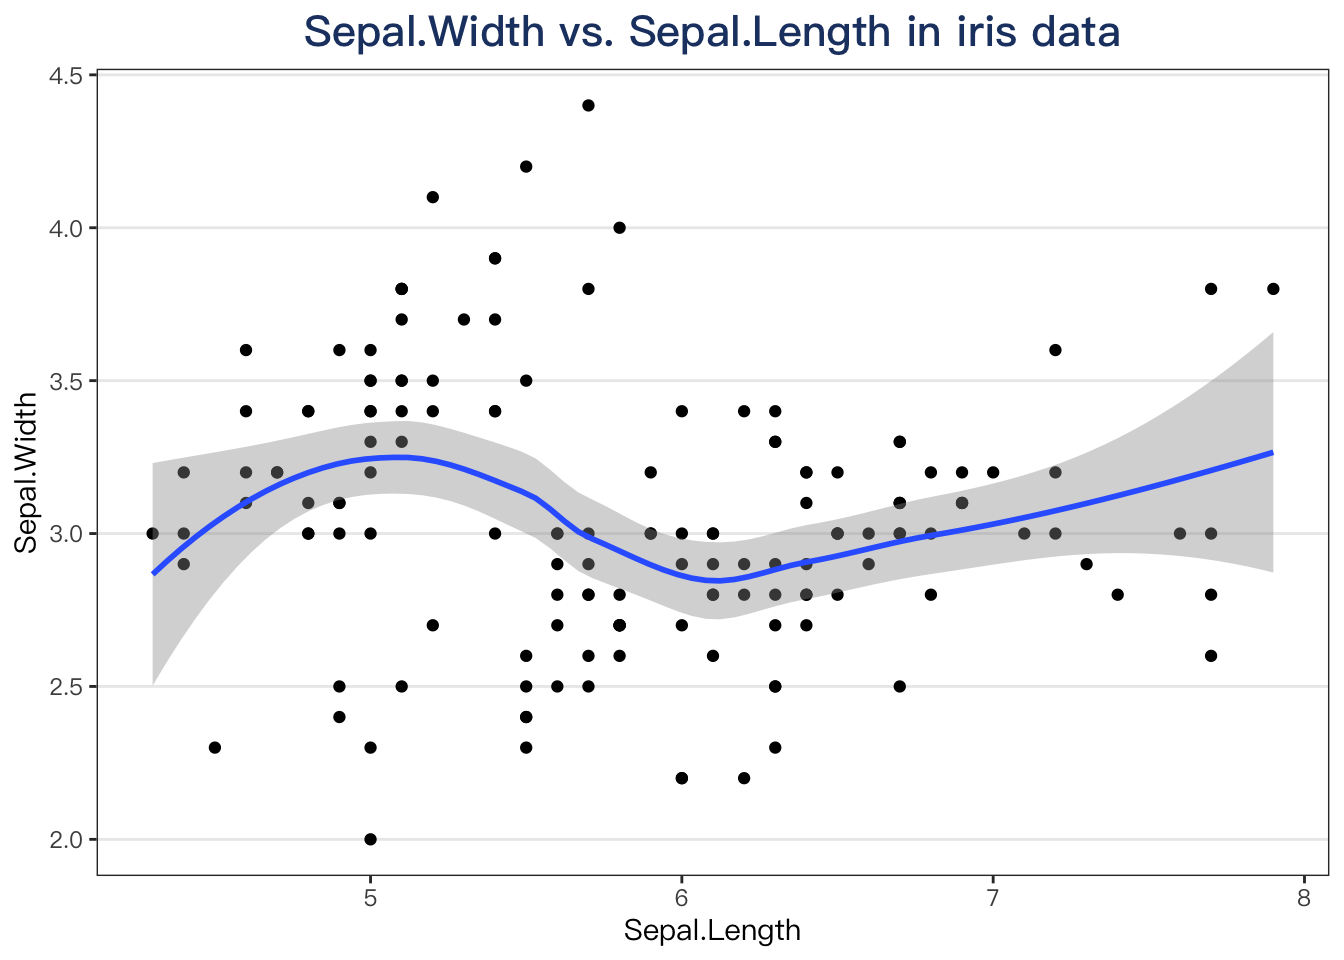
Remark: If you need to use/extract the variable name as a string, please use
enquo()andas_label()functions.
5.1 := 用于在 summarize 或 mutate 中声明新变量
In the following example:
The “walrus operator”
:=is used to create a column named after the variable name stored in thetarget_varargument (“price” in the example).The
:=allows you to use strings and evaluated variables (such astarget_nameandtarget_varin our example) on the left hand side of an assignment operation (where there would normally be a “=” operator) in functions such as “mutate” and “summarize”.
cal_group_stats4 <- function(data, group_var, target_var) {
  target_name <- as_label(enquo(target_var))

  data %>%
    group_by({{ group_var }}) %>%
    summarize(
      # use := to declare new column
      !!paste0("mean_", target_name) := mean({{ target_var }}),
      !!paste0("sd_", target_name) := sd({{ target_var }})
    )
}

# check
cal_group_stats4(dat, group_var = color, target_var = price)
## # A tibble: 7 × 3
## color mean_price sd_price
## <ord> <dbl> <dbl>
## 1 D 2594. 712.
## 2 E 2543. 769.
## 3 F 2692. 553.
## 4 G 2576. 715.
## 5 H 2308. 974.
## 6 I 1948. 1141.
## 7 J 1990. 1181.Remark: 在
summarize或者mutate函数里声明新变量时,如果等号到左边包含as_label(enquo(var)),需要使用:=,而非传统的🟰
6 sysms() function and !!!
The syms function and the !!! operator are used for passing a list
of variables as a function argument.
In prior examples !! was used to evaluate a single group-by
variable. We now use !!! to evaluate a list of group-by variables.
One quirk is that to use the syms function we will need to pass the
variable names in quotes.
cal_group_stats5 <- function(data, group_vars, target_var) {
  group_vars <- syms(group_vars)
  target_name <- as_label(enquo(target_var))

  data %>%
    group_by(!!!group_vars) %>%
    summarize(
      !!paste0("minVal_", target_name) := min({{ target_var }}),
      !!paste0("maxVal_", target_name) := max({{ target_var }})
    )
}

# check
# single group-by variable
cal_group_stats5(
  data = dat,
  group_vars = "color",
  target_var = price
)
## # A tibble: 7 × 3
## color minVal_price maxVal_price
## <ord> <int> <int>
## 1 D 357 2897
## 2 E 326 2897
## 3 F 342 2897
## 4 G 354 2896
## 5 H 337 2893
## 6 I 334 2896
## 7 J 335 2898# a list of group-by variables
cal_group_stats5(
data = dat,
group_vars = c("color", "clarity"),
target_var = price
)## # A tibble: 53 × 4
## # Groups: color [7]
## color clarity minVal_price maxVal_price
## <ord> <ord> <int> <int>
## 1 D I1 2869 2869
## 2 D SI2 2762 2896
## 3 D SI1 552 2896
## 4 D VS2 357 2897
## 5 D VS1 402 2861
## 6 D VVS2 554 2897
## 7 D VVS1 553 2866
## 8 E I1 345 2862
## 9 E SI2 326 2896
## 10 E SI1 326 2897
## # … with 43 more rows# a NULL group-by variable
cal_group_stats5(
data = dat,
group_vars = NULL,
target_var = price
)## # A tibble: 1 × 2
## minVal_price maxVal_price
## <int> <int>
## 1 326 2898Remark: 如果有多个group-by variables,那么需要使用
syms和!!!.
7 Summary
The variable I am referring here is the variable in the function argument:
{{}}operator is a shortcut for usingenquo()and!!.- If you need to use the variable name string, eg. use it in the
ggplot title, please use
enquo()andas_label. - If you need to declare the new variable in
summarize/mutate, DO NOT use=, please use:=instead. - If you have multiple group-by variables, the tidy evaluation
requires to use
syms()and!!!operator.